

How to Create Original Research That AI Assistants and Journalists Cite
 Catalin Dinca
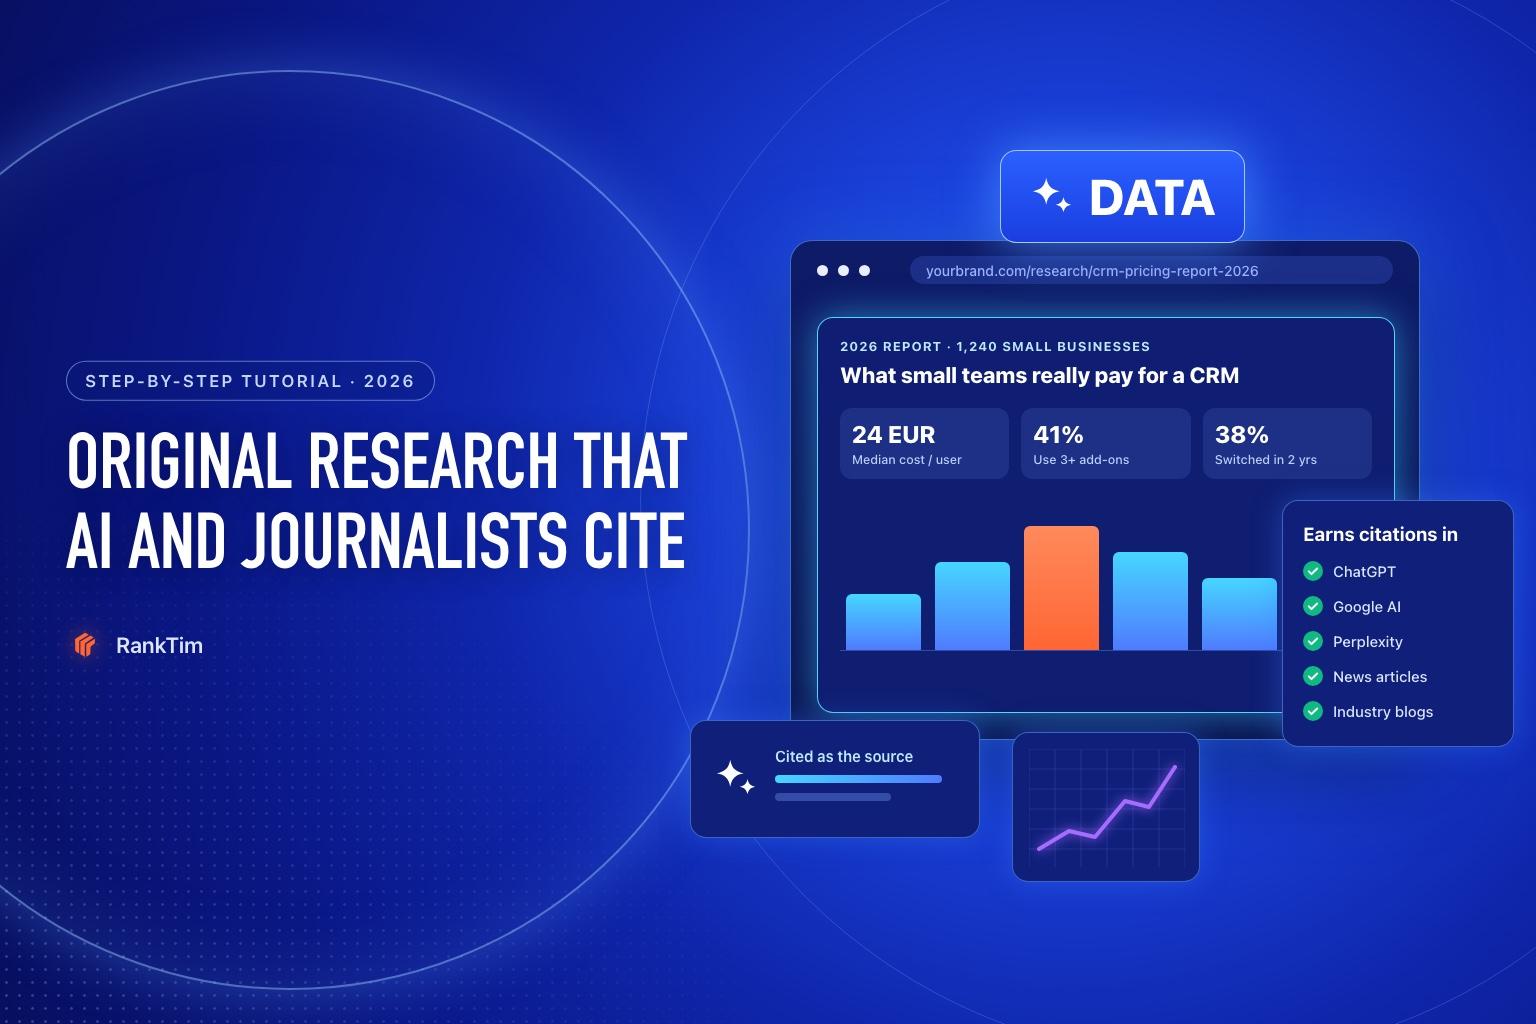
Most content on the web repeats what someone else already said. That's why the pages that publish something new, a number nobody had, a test nobody ran, a trend nobody measured, get linked, quoted and cited again and again.
AI assistants make this even more valuable. When ChatGPT, Perplexity or Google AI Overviews state a statistic, they look for a source to back it up, and they tend to cite the page where the number appears clearly, with context and a date. Journalists and bloggers work the same way. Google's own guidance on helpful content asks whether a page provides "original information, reporting, research, or analysis".
This tutorial shows how to create original research that earns citations from AI and the press, even if you're a small team without a data department.
Time needed: two to four weeks for a first study, depending on how you collect the data. Most of that time is waiting for survey responses.
Why Original Data Earns Citations
- It's the only source. If you publish a number first, everyone who uses it needs to cite you.
- It answers specific questions. "How much do small agencies spend on software?" needs a figure, and AI assistants prefer sources that provide one.
- It earns links without asking. Writers looking for statistics find your page and link to it as the source.
- It builds authority. Being the brand that measures the market makes you the brand people trust in it.
Types of Original Research You Can Run
You don't need a large budget. Pick the type that fits the data you already have or can collect.
| Type | Example | Effort |
|---|---|---|
| Customer or industry survey | "What 500 small business owners pay for marketing tools" | Medium |
| Anonymized product data | "Average response time across 10,000 support tickets" | Low, if you have the data |
| Analysis of public data | "How many local businesses have a complete Google profile, by city" | Medium |
| Hands-on tests | "We tested 12 website builders on page speed" | Medium to high |
| Price or trend tracking | "CRM prices from 2024 to 2026" | Low to medium |
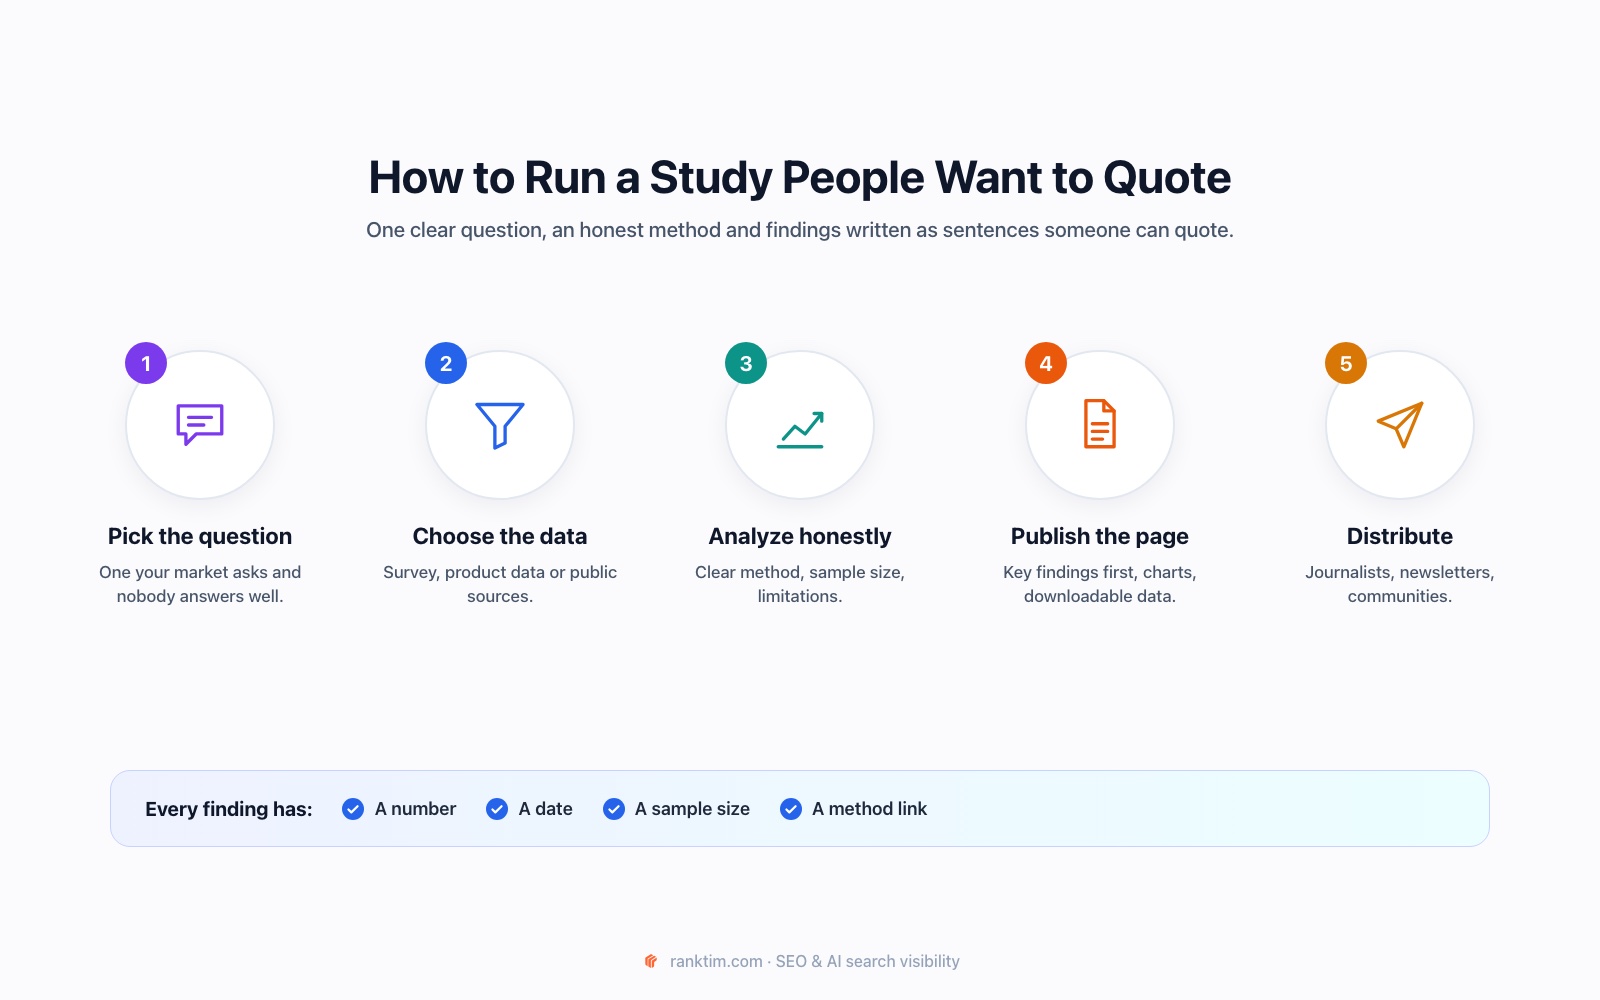
Step 1: Pick a Question Your Market Actually Asks
The best research question is one people already ask but nobody answers well. Look for it in:
- AI answers: run prompts in your category and note where assistants give vague answers, use statistics that are several years old or cite sources that don't really fit. Our prompt research tutorial shows how to build the prompt list.
- Search Console and keyword tools: queries that include words like "statistics", "average", "how much", "how many" or "benchmark".
- Sales and support: the questions prospects ask before buying, such as "what do other companies like us usually pay?"
- Industry articles: statistics that everyone repeats but no one can trace to a recent source.
Write the question as one sentence. "What do small agencies really pay for a CRM in 2026?" is a good research question. "The state of CRM" is not.
Step 2: Choose the Data and the Method
Decide how you'll answer the question and write the method down before you start, so you can explain it later.
- Surveys: ask few, specific questions, mostly multiple choice. Recruit through your customer list, newsletter, communities or a panel provider. A few hundred responses from the right audience is far more valuable than thousands from the wrong one.
- Product data: use only aggregated, anonymized data and make sure your terms and privacy policy allow it. Never publish anything that could identify a customer.
- Public data: official statistics, public registers, websites or app stores. Respect each source's terms of use.
- Tests: define the setup, the tools and the measurement so someone else could repeat it.
Record the basics for every study: what you measured, the sample size, who was included, when the data was collected and any known gaps.
Step 3: Analyze Honestly
The credibility of the whole study depends on this step.
- Don't cherry-pick. Report the findings that don't flatter your product too.
- Show the sample size next to every percentage. "41% of respondents (n=1,240)" is quotable; "41% of businesses" is not.
- Separate correlation from causation. "Teams using X report Y" is not the same as "X causes Y".
- List the limitations, such as who might be missing from the sample, self-reported answers or a short collection period.
- Ask someone outside the project to check the numbers before you publish.
Step 4: Write Findings People Can Quote
Most people, and AI assistants, will use one sentence from your study, not the whole report. Make that sentence easy to lift.
A good finding has a number, a group, a time frame and a source:
- Weak: "CRM prices are going up."
- Strong: "Small agencies paid a median of 24 EUR per user per month for their CRM in 2026, according to a survey of 1,240 businesses by YourBrand."
Write five to ten key findings like this and put them at the top of the page. Each one should still make sense when it's copied on its own.
Find the questions AI answers with weak or outdated data
RankTim tracks your prompts across ChatGPT, Gemini, Perplexity, Google AI and Copilot, shows the full answers and lists every source they cite. Old statistics and vague answers are your research opportunities.
Start Your Free TrialStep 5: Build a Research Page AI Can Parse
The page itself needs to make your findings easy to find, understand and cite.
- Start with key findings, as a short list, before any introduction.
- Add charts with text, never charts only. Write the main number in the caption or the text next to it, because a chart image alone is hard to quote.
- Include a methodology section: sample size, who took part, dates, how data was collected and the limitations.
- Offer the data: a downloadable CSV or a summary table makes your study more useful to journalists and researchers.
- Show the author and the date clearly, and update the date only when the data actually changes.
- Add structured data:
Articlemarkup for the page and, if you publish the dataset,Datasetmarkup so it can appear in Google Dataset Search. Our schema markup guide shows how. - Make it easy to cite: add a short "How to cite this study" line with the title, your brand and the URL.
| Section | What it does |
|---|---|
| Key findings | Gives readers and AI the quotable statements in seconds |
| Charts and tables | Shows the detail behind each finding |
| Methodology | Proves the numbers can be trusted |
| Data download | Lets journalists and researchers reuse it, with credit |
| How to cite | Makes correct attribution the easy option |
Step 6: Distribute the Study
Publishing is only half the job. A study nobody sees earns no citations.
- Journalists and writers: send a short email with two or three findings that matter to their audience, not the whole report. Local and trade media are often more responsive than national outlets.
- Expert request platforms: reply to journalist requests on topics your data covers.
- Your own channels: newsletter, LinkedIn, social posts with one chart each.
- Communities: share the findings where they genuinely help a discussion, following each community's rules. Our guide to Reddit and online communities explains how to do it without spamming.
- Pages AI already cites: suggest your data to authors of the articles that appear in AI answers for your prompts. The citation outreach tutorial shows how.
Step 7: Track Citations, Links and Mentions
Measure the study the way you'd measure any piece of AI visibility work:
- AI citations: how often assistants cite your research page for your tracked prompts.
- Brand mentions in AI answers: whether AI now names your brand when it gives the statistic.
- Backlinks and referring domains to the study page.
- Press and blog mentions, including ones that quote your data without linking. Ask them politely to add the link.
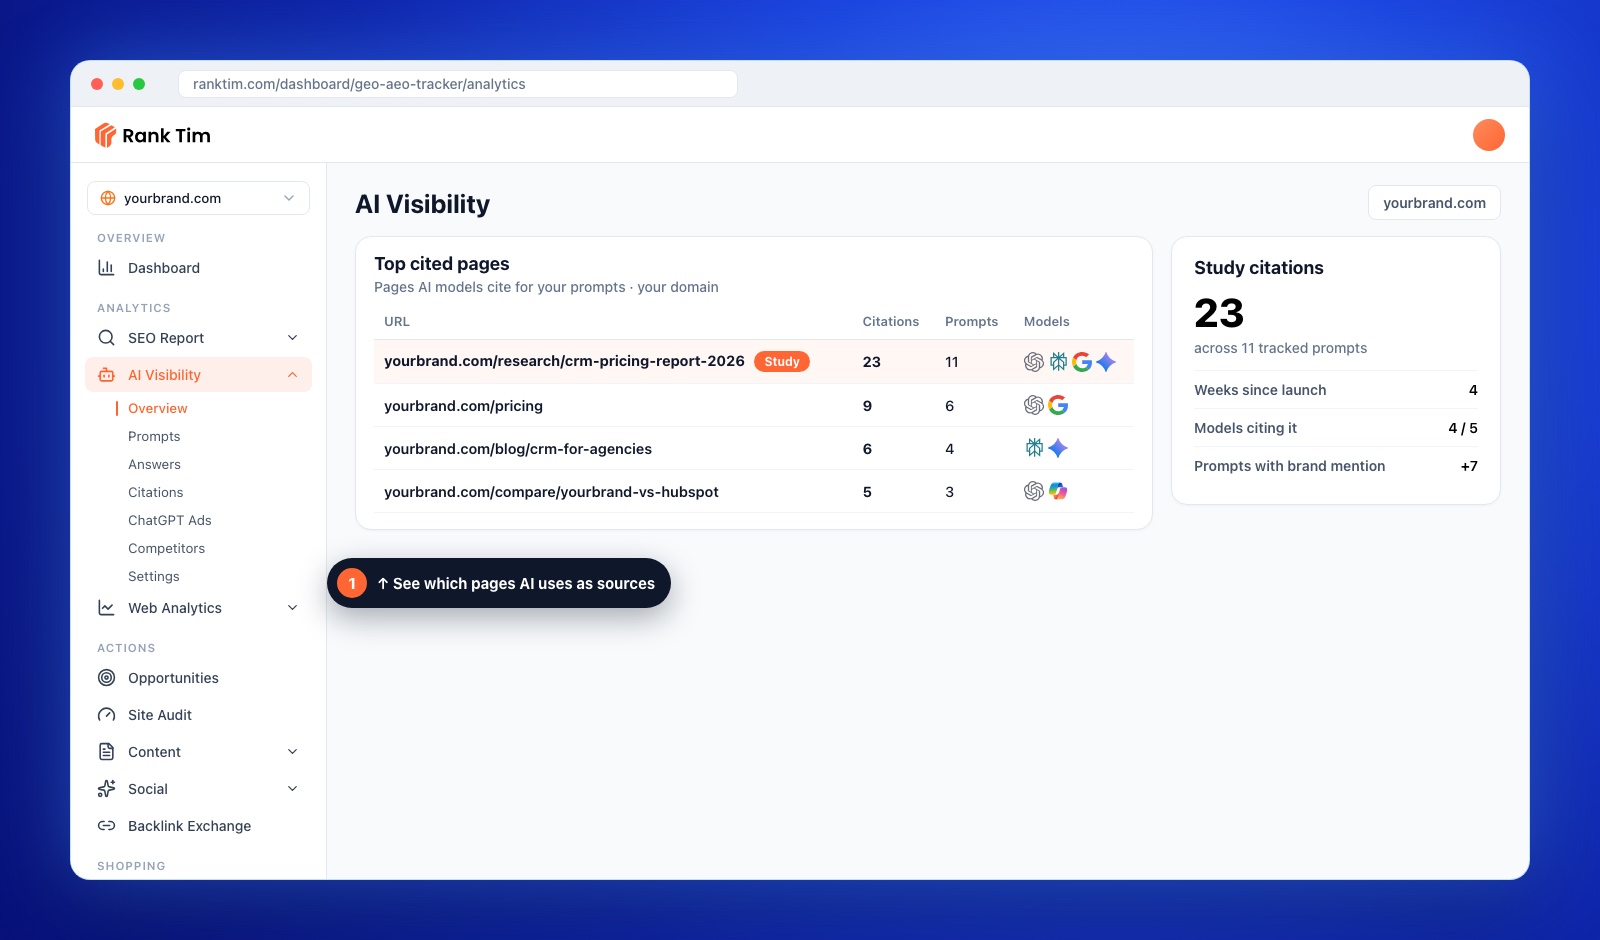
In RankTim, open AI Visibility → Overview and look at Top cited pages. It lists the pages AI models cite most often for your prompts, with the number of citations and the models citing them, so you can see when your study joins the list. Add prompts related to your study, such as "how much do small agencies pay for a CRM", so you can follow its impact.
Step 8: Update It, and Make It a Series
A study cited this year will be considered outdated in two or three years. Plan to repeat it.
- Repeat the study every year with the same method, so you can show trends. Year-on-year changes are themselves new findings.
- Choose a URL strategy: keep one URL and update it with each edition, or publish a new page per year and link all editions together. Don't let old editions compete without links between them.
- Refresh the findings, the date and the "How to cite" line with each update. Our content refresh guide covers how to update pages without losing rankings.
Common Mistakes to Avoid
- Researching a question nobody asks. Start from real queries and prompts.
- Hiding the method. Without it, careful writers won't cite you.
- Publishing only a PDF. Put the findings on a normal web page that search engines and AI can read.
- Burying the numbers in long paragraphs or chart images.
- Turning the study into a sales pitch. Keep the product mentions short and separate from the findings.
FAQ
How big does my sample need to be?
It depends on the question and on how much detail you want. A few hundred well-targeted responses is usually enough for clear headline findings. Always publish the sample size and avoid splitting results into groups too small to be reliable.
Can a small company do original research?
Yes. Anonymized product data, small focused surveys and hands-on tests are all within reach of small teams. A narrow, specific study often gets cited more than a broad, generic one.
Does original research help with AI search?
Yes. AI assistants need sources for specific facts and figures, and pages that state them clearly with context and a date are easy to cite. Track the results with your prompts to see the effect.
Should I gate the report behind a form?
Keep the key findings and methodology on an open page. You can offer a detailed version for download in exchange for an email, but if everything is gated, AI and journalists can't read or cite it.
How often should I publish new research?
One or two solid studies a year, updated regularly, are better than many small, rushed ones. Consistency also builds expectation: people start waiting for your annual report.
Original research is one of the few forms of content nobody can copy without crediting you. Ask a real question, answer it honestly and make the answer easy to quote, and AI assistants, journalists and your market will keep coming back to your page as the source.
Become the Source AI Quotes
Find the questions your market asks, publish the data that answers them and track how often ChatGPT, Gemini, Perplexity and Google AI cite your pages.
Start for Free
Catalin Dinca
Written by Catalin Dinca